Survey Designer
A simple, sophisticated, and powerful tool designed for building surveys, measuring data, and understanding customer feedback, in order to advance the world of market research.

Why?
By building, Survey Designer we brought forth a new application in the market, specialized for surveyors to build interactive, and powerful questionnaires in order to obtain customer feedback and gain insight in understanding their audience preference. Different from competitors, our product was the first to simplify presentation and production for survey researchers. On average a common survey programmer works 11-12 hour work days. We wanted to reduce these working hours back to 7.
With our application, our highest and most important goal was simply— to make the lives of survey programmers easier.
Project Overview:
-
Company.
Affiliated with MarketOnce; ROI Rocket is a leading provider of research services in the consulting, financial, healthcare, consumer product, and B2B— markets.
-
Tools.
Figma
Adobe Illustrator
InVision Studio
-
Role.
Lead Designer :
Oversaw the entire design of the product from initial stages to continuous development.
-
Team.
Designer, executives, project manager, and the development team of engineers.
-
Duration.
1 year.
Introduction
Customer surveys are used to understand customer satisfaction and can be used to gauge customer needs, and understand problems. All consumers expect a certain level in experience so by building a tool capable of obtaining proper feedback, customer surveys provide insight in analyzing trends, understanding metrics, and improve company-wide-effort.
When you’re asked: What is a survey? The answer to this question seems pretty simple. Many of you probably know exactly what comes to mind. What is your age? What is your favorite color? All of these questions seem basic enough for almost anyone to build.
However, what a lot of us; including myself at first, don’t comprehend the first time around is how complex a simple list of questions can become. By applying intensive logic and complex survey components, studies launched deep within the world of market research can get extremely intricate when introduced with specified requirements requested by a client.
In addition, getting faster insights is imperative to business success, therefore marketing research companies must rely on digital software and solutions.
Survey design tools allow for market researchers to incorporate a huge range of features when it comes to data collection to increase response rates; such as building in innovative question types, multimedia clips, and a powerful array of feedback methods that are all designed to engage survey respondents and capture useful insight.

Being able to take these complex needs to go beyond collecting data to not only expand your market research capabilities, but deliver seamless customer experience— is when you have a platform effective on both sides: from a survey designer, to a survey respondent.
Questionnaire Programming Terminology:

During the research process we put together some important terms used often in the world of market research. Here’s an example of a few common terms.
Among the many problems market researchers face today, the no. 1 issue is their inability to work at a faster pace due to the current lagging of marketing research tools available today. The unfortunate truth is that there are softwares available in the market to help make this research move easily; however as time progresses market research projects have been getting more and more complicated while these tools haven’t even considered upgrade.
The process of receiving direction and protocol from a client, then building a survey that meets those requirements, and then actively monitoring not only 1 but 10-25 projects a week goes to show that the life of a survey programmer is filled with a number of tasks. So even before diving deep into our research process we determined after speaking to market research project managers that survey designers have faced difficulty building surveys that can’t:
Allow for easy navigation between surveys that can range up to hundreds or thousands of questions.
Contain a wide range of question types beyond the more common set.
Display a WYSIWIYG style of editing in which building questions resemble its final preview.
Handle and build in complex logic in a clean, simplified user flow.
Enforce quota management without the need of a third party service.
Display relevant information crucial to the status and reporting of a project on a more interactive project account dashboard.
The Problem
Users & Audience
Survey Designer was built and designed for market researchers, project managers, and of course— survey designers.
This target group was identified by our team and interviewed to better understand their day-to-day working in environments involving sharp analytical, communication, and detail oriented skills. Through inquiry we discovered these users have a strong preference for neat categorization that integrated all their survey software into a single application that performed at the complexity and technicality as they did.
Team & My Role
I was hired and handed the task as Lead Designer of ROIRocket’s newest marketing software application. As design lead, I oversaw the entire design of the product from the initial ideas stage to continuous development all while working closely with my CTO, project managers, and development team of engineers to bring forth the launch of Survey Designer. In the duration of this project, I managed weekly agile sprints to deliver and improve design and development in a fast-tracked environment. Working in these week long sprints I was responsible for all facets of design including:
Interaction, visual, product, wireframing, and prototyping.
I worked to design intuitive and powerful interfaces all while ensuring organized user flow and delivered insight to solve challenges by conducting user research using methods such as interviews and cognitive walkthroughs to translate difficult concepts into good design.
In addition to design, I was also responsible for resolving technical issues through QA manual testing. I worked with my dev team to identify UI and behavioral issues and created animated video assets to better improve both: software and design.
Design Approach
01 Research
02 Strategy
03 Design
04 Prototype
First we had to lay out our project goals:
Design an end-to-end flow to create a project, and build a survey.
Empower users with clear design and flow making sure all properties involved in designing a complicated survey— are not complicated.
Integrate all tools and methods of market research science into one organized platform to construct an application powerful enough to build and measure selected data.
Making sure we met our user’s needs.
01 Research
Great research can create good design— and good design, is good business. This step of the design process lay out the essential foundations for creating our solution and was tackled by making sure our research stayed on track. So we created a research plan.
I first identified our research goals, and how i’d go about meeting them.
I then put together some questions that would help us understand our key specs and allow us to navigate on how to incorporate them into our design (below are just a few).
In order to properly identify our product’s most crucial needs, we took the time to study our competitors and their weaknesses.
In the duration of this study we were able to identify their UX processes and determine what worked— and what did not. We based our decisions by taking the time to use these products ourselves in addition; interview multiple stakeholders to understand their needs and key pain points. Through interviews and usability testing we were able to conduct brief walkthroughs tests and analyzed how our stakeholders completed basic tasks involved with building a survey using the existing platforms within the market today. In this process many of them voiced their issues on the strengths and weaknesses of each competitor product.
02 Strategy
Brainstorming
After identifying the solutions we could implement in our product through the research we obtained— I began my brainstorm to map out user flows based on those key solutions. One of the most important ideas that was discovered during this process was the implementation of what we later termed as our: Quick Editor.
All ideas and goals we had revolving around the designer itself were great but we knew our Quick Editor would be the highlight solution to all survey programming issues. The usual process behind designing a survey begins with the first step; and that is, a client handing over a document of all survey requirements and survey elements. This project bible usually contains all question types, choices, quota requirements, survey design requirements, and pretty much anything else the client wants to put in their project. So keeping that in mind— the team suggested the build of an editor that would allow survey programmers to copy and paste this document of questions directly onto the quick editor modal and identify what text was what using hot keys; or keyboard shortcuts, before certain document text to indicate what was what. (i.e inserting commands like \N right before question name or \T before question text).
No other survey designing platform in the market had this feature so pulling this off meant we’d be in for a HUGE WIN.
We were entering the phase in our project that got the whole team excited so as expected, the throwing of ideas followed with a lot of meetings and a whole lot of whiteboarding.
The Core Functionality:

First draft of our overall application map (a very basic end-to-end flow of Survey Designer).
Simplifying User Flow
After all, one of the main features of our product was to enable users to quickly and easily consume survey tools they used frequently on a day-to-day basis.
Note: You will notice that some of the images that follow have purposely been resized to protect company information. If you’d like to see more let me know.

Some of these features included a simplified UX of:
Overall survey navigation.
Adding in question properties such as: show, navigate, terminate, validation, binding, rotation, actions, and most importantly logic.
Incorporating quota management.
Editing within a JSON formatting editor for the survey programmers who prefer building in a JSON style syntax.
Managing grid style questions and other complex variety of different question types.
To simply navigation through Survey Designer, I identified the main flow of users when completing specific tasks. Designing by thinking through the necessary steps helped me identify the main flow of users in which I mapped out different scenarios of different survey elements used within research studies.
Based on the user flows of these key features, I constructed the information architecture so that there was a minimal level of difficulty when accessing relevant information. During this process I found it best to begin rapidly iterating a range of ideas by exploring the interface and visual design.
03 Design
Sketches
Sketches allow me to quickly capture my ideas on paper. By examining my ideas roughly, I have the ability to convey the visual solutions I have in mind, to the team without having put in too much effort into my design look. This process in design usually takes me the longest because…
Well I’d prefer to fail early, then later.


Wireframing
Once I had the visual direction approved by my execs and project managers— I began adding more details and precisions to my sketches on Figma. I began by creating low fidelity wireframes that helped me focus on layout and hierarchy before going into any further detail.

In this example above I designed screens specific to solving our overall navigation issue that survey designers addressed during their interviews. Due to the fact that no survey building platform up to date allows for user friendly navigation within surveys that contain 1000+ elements— I proposed a few solutions and put together mid-fidelity prototypes to present to my execs and stakeholders to conduct A/B testing and determine which design approach would be the best approach to proceed with. You will notice the different solutions I came up with in the examples below with proposals and changes made to the left hand side navigation toolbar. A combination of the first two wireframes won and was selected as our final design approach.


04 Prototype
High-Fidelity Prototypes
For an overall seamless user experience, I deliberately chose the best of concepts from each wireframe and created high fidelity prototypes in return. I used established designs and focused on creating a friendly, and Material Design inspired interaction model. The goal in building these prototypes was to communicate high level information into design that exhibited, clarity.

Project Dashboard:
Edit Project:

Share Project:


Project Settings:

Survey Designer: Project Overview

Depending on the status of a project, our platform navigates to what you need during the time span of your project. So if a project is live, selecting the project will take you directly to monitoring of data and analysis. Likewise if a project is in draft mode, selecting the project takes you to our survey editor.
Survey Designer: Quota Management

The quota designer builds and monitors quotas specific to the project

View, edit, and build a specific quota all in one place by adding questions from your survey

Set filters to the added questions in your quota and filter out selections using our dynamic table to set targets to individual cells


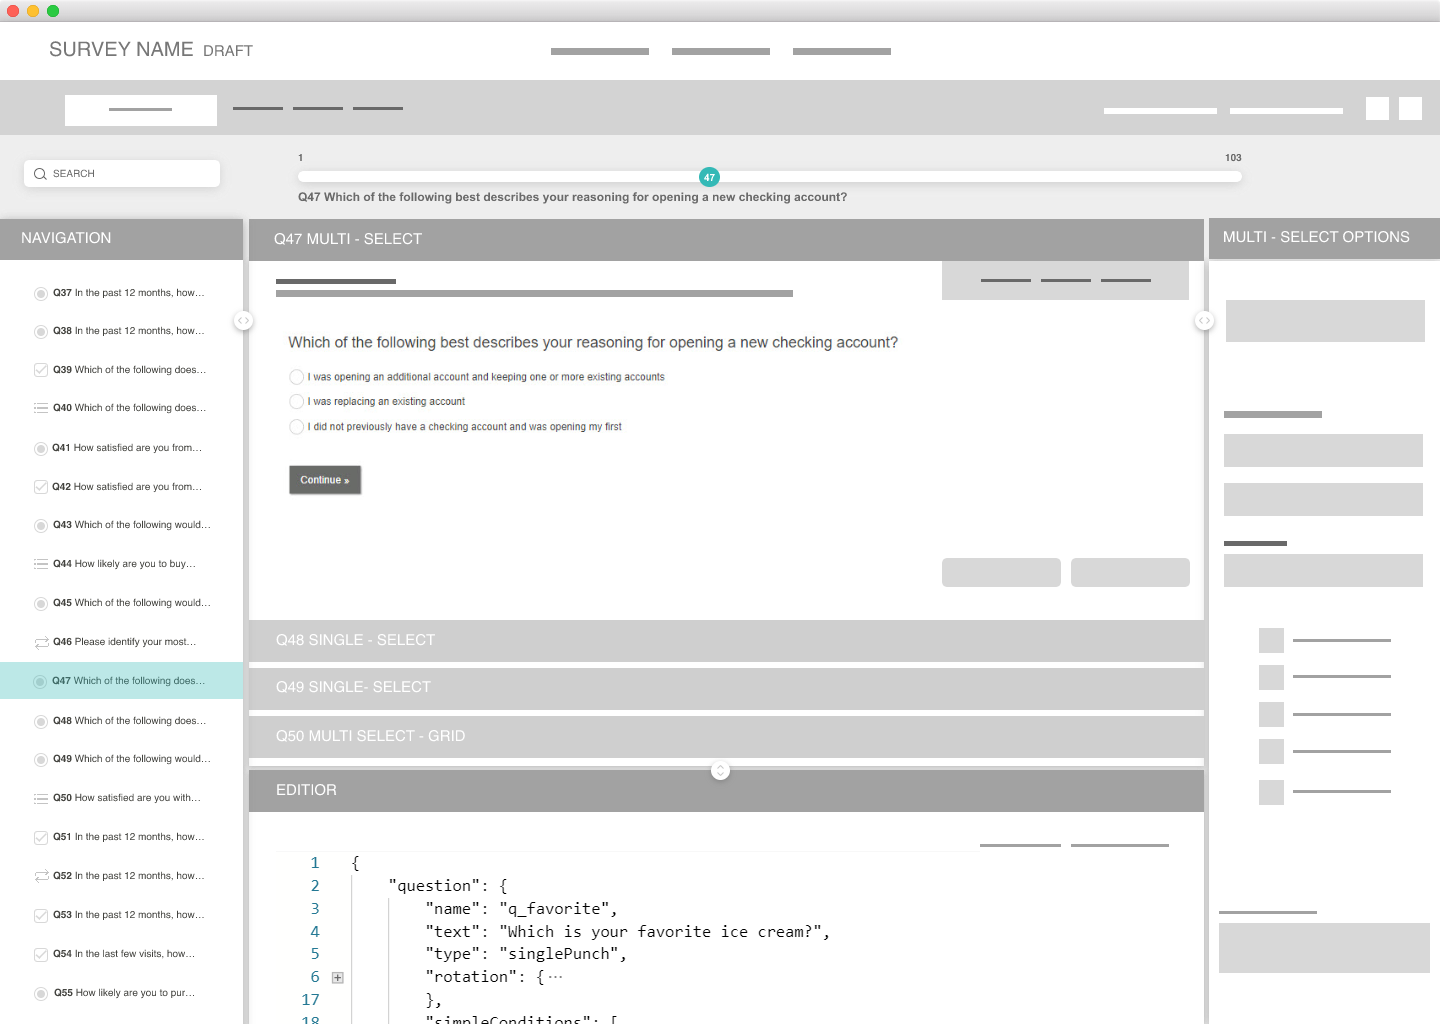
A WYSISYG styling approach of editing question cards.
Otherwise known as; what you see is what you get.
We chose this specific style of question card formatting because users would be able to edit directly onto a mockup question card similar to its preview for the respondent. With this feature, survey programmers would no longer need to spend time in deciphering how a specific question would appear when chosen a certain question style.
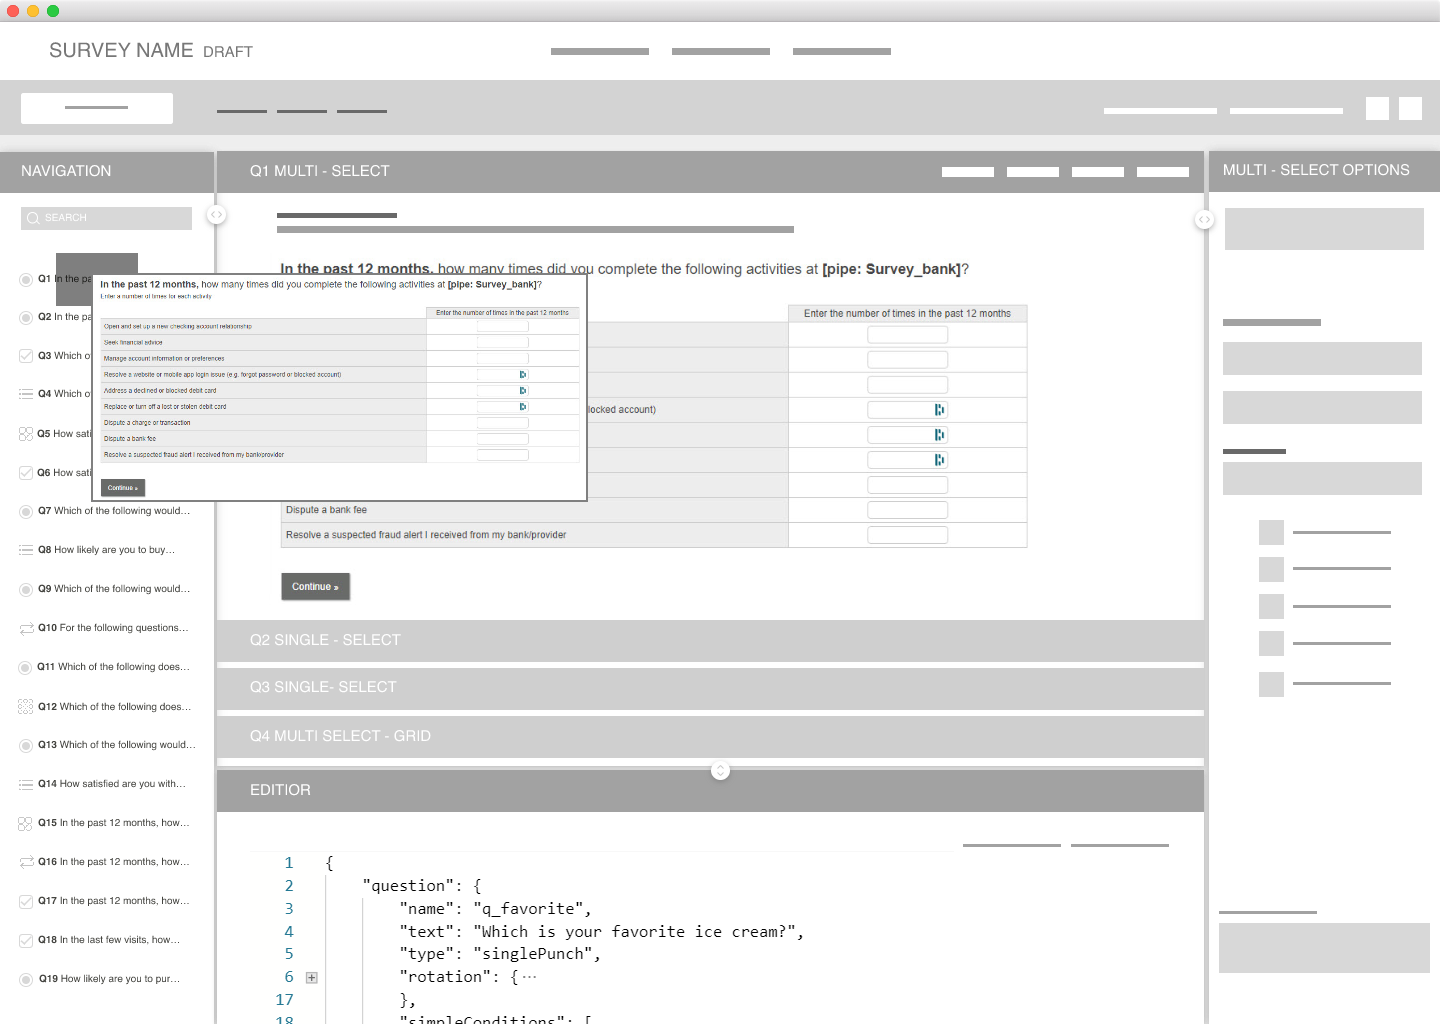
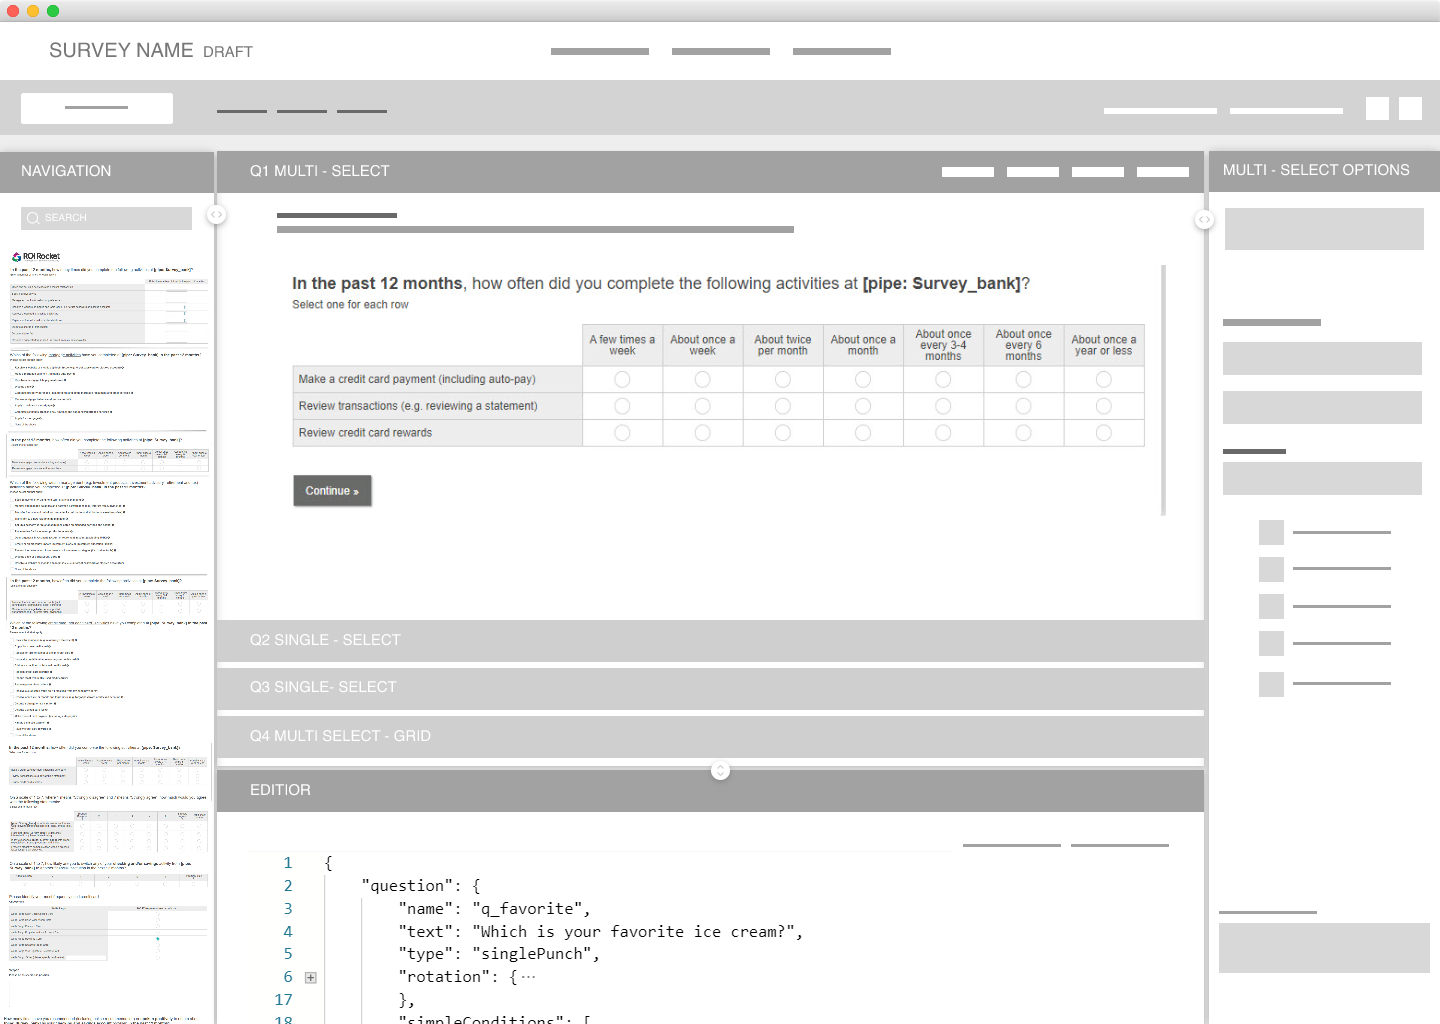
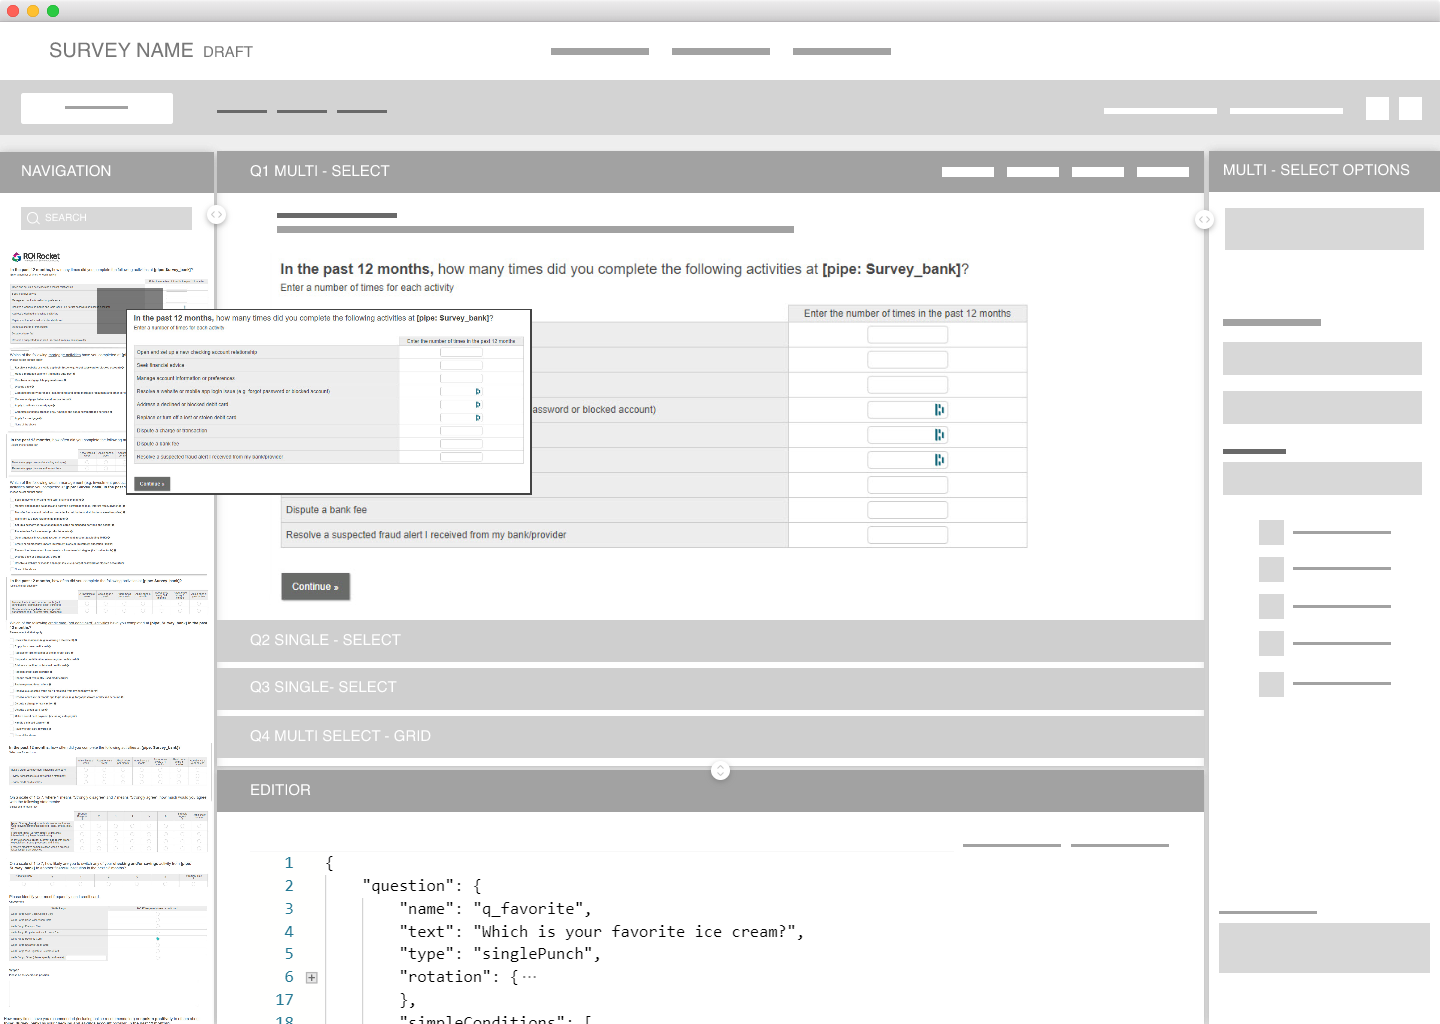
Grid Editor

The grid editor was designed for advance edit within a question card. Although its best usage would be for grid style questions— the rows, columns, and cells tab makes modification for each choice for a question, accessible and easy to follow.
Adding Logic

Through the use of our logic modal, users can add logic depending on their desired logic condition. In this image— the logic condition is navigate.
Once a user selects the property “Navigate to” this modal will allow easy direction onto what question and values a respondent would need to have selected in order to navigate to this specific question. A similar modal is used for logic conditions: Show, and Terminate.
Building Conditions

Unlike any survey designing application in the market today, the Condition Builder would be the first in all marketing research to allow users to implement the same logic conditions under one title to then be applied wherever needed throughout the survey.
This feature no longer requires survey designers to write more than one of the same logic statements to be assigned and used across their project.

Brand and stying guide for Survey Designer: Request to see the full document
There’s still so much more to share so if you’d like to see more let me know!
What’s next?
Survey Designer is currently undergoing updates, revisions and QA. After launch we introduced our product to our users and conducted remote and moderated phone interviews. We presented our application by instructing our stakeholders with tasks and allowing them to navigate through our product while we observed. At the end of these interviews we asked our participants follow-up questions to get their feedback in order to make revisions and upgrade our software.
Updates and revisions are being addressed based on their priority level.
Reflection
Designing a tool to advance the world in market research.
The highlight of my experience working with ROIRocket was in all— my chance at walking through the mindset and process of a product designer. As a designer who had no background in market research I learned how to create meaningful design experiences by obtaining customer feedback from our product users which ultimately shaped the end result of our application.
With the final prototype I created, I believe I met all goals outlined in the beginning of our design process. I also learned bringing in engineering teams, early on in our projects also helps development go smoothly and being able to manage working in weekly agile sprints, allowed me to deliver and improve product design and development week by week by setting weekly goals I knew I had to meet by sprints end.
Although there is still much to accomplish for our product as far as revisions, new features, and updates go— I was grateful I had the opportunity to dive head in and lead the design of this powerful application.